5 · The benchmark scoreboard — where CHC wins, and by how much
One anecdote is not evidence. chc ships a small benchmark suite of control tasks that each carry
a known ground-truth interventional effect, so we can measure regret vs an oracle that plans on
the true system. Across three structurally different tasks, the CHC controller beats the naive
baseline every time. Under confounding (pricing, inventory) it matches the oracle. On support-shift,
pessimism cuts the greedy controller's regret by nearly two thirds, but it still costs about 12 % more
than the oracle.
| task | what the controller decides | the trap |
|---|---|---|
| pricing | how hard to steer a KPI to target | confounded logs flip the action's sign |
| inventory | how much stock to order (newsvendor) | biased demand-response ⇒ systematic mis-order |
| support-shift | how large an action to take | model is trusted where it was never trained |
The newsvendor orders stock once and pays for both leftovers and shortages. The CHC controller is
causal-CHC on pricing and inventory: it adjusts for the confounder. On support-shift it is
pessimistic: it penalises actions outside the logged support. The naive baseline is predictive
(an unadjusted fit) or greedy (it trusts the model everywhere).
Metrics per controller: cost, regret (cost − oracle_cost, lower is better), constraint
violations, and out-of-support action rate.
import jax
import matplotlib.pyplot as plt
import numpy as np
import pandas as pd

jax.config.update("jax_platforms", "cpu")  # the outputs below were made on a CPU
%matplotlib inline

from chc.benchmark import InventoryTask, PricingTask, SupportShiftTask

TASKS = {
    "pricing": PricingTask(),
    "inventory": InventoryTask(),
    "support-shift": SupportShiftTask(),
}
# the "CHC" controller and the naive baseline differ per task; name them so we can compare fairly
CHC_OF = {"pricing": "causal-CHC", "inventory": "causal-CHC", "support-shift": "pessimistic"}
BASE_OF = {"pricing": "predictive", "inventory": "predictive", "support-shift": "greedy"}

rows = []
for task_name, task in TASKS.items():
    for r in task.run():
        rows.append(
            {
                "task": task_name,
                "controller": r.controller,
                "cost": r.cost,
                "regret": r.regret,
                "violations": r.constraint_violations,
                "ood": r.ood_rate,
            }
        )
board = pd.DataFrame(rows)
The full scoreboard
Read it by task. The oracle plans with the truth: the true effect on pricing and inventory, the true plant on support-shift. It is the reference, not a lower bound: on pricing, causal-CHC lands 0.003 below it on this noise path. The CHC controller sits next to the oracle on pricing and inventory. The baseline pays a larger regret on every task and, where applicable, violates constraints and acts outside the logged support.
violations means a different thing in each task. On pricing it is the share of steps with
|x| > 6. On inventory it is the stockout rate: the newsvendor optimum accepts 20 % stockouts, so the
oracle's 0.20 is by design. Support-shift has no state constraint, so its violations is 0 by
construction. ood is 0 by construction on inventory, which places a single order.
styled = (
    board.set_index(["task", "controller"])
    .round(3)
    # regret spans several orders of magnitude, so shade its logarithm
    .style.background_gradient(
        subset=["regret"], cmap="Reds", gmap=np.log10(board["regret"].clip(lower=1e-3)).to_numpy()
    )
    .format({"cost": "{:.2f}", "regret": "{:.2f}", "violations": "{:.2f}", "ood": "{:.2f}"})
)
styled
| cost | regret | violations | ood | ||
|---|---|---|---|---|---|
| task | controller | ||||
| pricing | oracle | 4.59 | 0.00 | 0.00 | 0.00 |
| causal-CHC | 4.59 | -0.00 | 0.00 | 0.00 | |
| predictive | 13740.08 | 13735.49 | 0.97 | 1.00 | |
| inventory | oracle | 0.71 | 0.00 | 0.20 | 0.00 |
| causal-CHC | 0.71 | 0.00 | 0.20 | 0.00 | |
| predictive | 1.80 | 1.10 | 0.76 | 0.00 | |
| support-shift | oracle | 20.64 | 0.00 | 0.00 | 0.00 |
| pessimistic | 23.07 | 2.43 | 0.00 | 0.00 | |
| greedy | 28.07 | 7.42 | 0.00 | 0.40 |
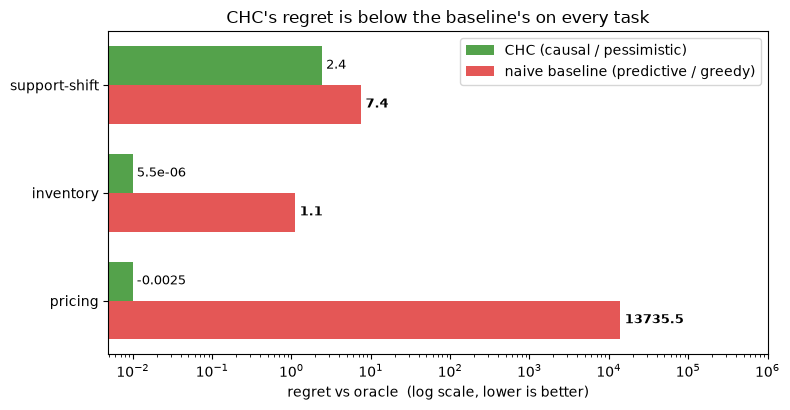
The headline: regret, CHC vs the naive baseline
Regret spans several orders of magnitude, so the bars are on a log scale. A floor of 0.01 keeps
the near-zero CHC bars visible; the oracle's regret is 0 by definition and is not drawn. The gap is
the value of the library.
def regret_of(task: str, controller: str) -> float:
    match = board[(board["task"] == task) & (board["controller"] == controller)]
    return float(match["regret"].iloc[0])


summary = pd.DataFrame(
    {
        "CHC (causal / pessimistic)": [regret_of(t, CHC_OF[t]) for t in TASKS],
        "naive baseline (predictive / greedy)": [regret_of(t, BASE_OF[t]) for t in TASKS],
    },
    index=list(TASKS),
)

fig, ax = plt.subplots(figsize=(8, 4.2))
floor = 0.01
y = np.arange(len(summary))
h = 0.36
ax.barh(
    y + h / 2, summary.iloc[:, 0].clip(lower=floor), h, color="#54A24B", label=summary.columns[0]
)
ax.barh(
    y - h / 2, summary.iloc[:, 1].clip(lower=floor), h, color="#E45756", label=summary.columns[1]
)
ax.set_yticks(y)
ax.set_yticklabels(summary.index)
ax.set_xscale("log")
ax.set_xlim(right=1e6)  # room for the label of the longest bar
ax.set_xlabel("regret vs oracle  (log scale, lower is better)")
ax.set_title("CHC's regret is below the baseline's on every task")
for i, (chc, base) in enumerate(zip(summary.iloc[:, 0], summary.iloc[:, 1], strict=True)):
    ax.text(max(chc, floor), i + h / 2, f" {chc:.2g}", va="center", fontsize=9)
    ax.text(max(base, floor), i - h / 2, f" {base:.1f}", va="center", fontsize=9, fontweight="bold")
ax.legend(loc="upper right")
plt.tight_layout()
plt.show()
The win in one number per task
factor = pd.DataFrame(
    {
        "CHC regret": summary.iloc[:, 0].values,
        "baseline regret": summary.iloc[:, 1].values,
        "regret reduction": [
            f"{b / c:,.1f}x lower" if c > 0.05 else "CHC = oracle (regret ~0)"
            for c, b in zip(summary.iloc[:, 0], summary.iloc[:, 1], strict=True)
        ],
    },
    index=list(TASKS),
).round(3)
factor
| CHC regret | baseline regret | regret reduction | |
|---|---|---|---|
| pricing | -0.003 | 13735.493 | CHC = oracle (regret ~0) |
| inventory | 0.000 | 1.098 | CHC = oracle (regret ~0) |
| support-shift | 2.428 | 7.421 | 3.1x lower |
Takeaway
The advantage is not one lucky example. Under confounded steering (pricing) and biased demand response (inventory), CHC matches the oracle. There the predictive baseline costs about 3,000 times the oracle on pricing (13,740 against 4.59) and about 2.5 times it on inventory (1.80 against 0.71). Under off-support model exploitation (support-shift), pessimism rather than causality is the safeguard, and the margin is smaller: regret 2.4 against the greedy controller's 7.4. Each task here runs one seed; the 12-seed bootstrap intervals on the benchmarks page give the same ordering. The benchmark, with its ground-truth effects, is what lets us quantify the win instead of asserting it.